The graph shown below depicts the hormonal changes that occur during the female reproductive cycle. Day one on this graph represents the onset of menses. Which of the labeled curves in the graph represent hormones that are released by the ovaries? 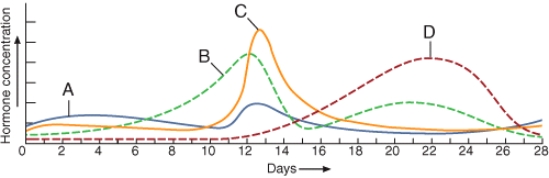
A) A and B
B) B and C
C) B and D
D) A and C
E) All of the hormones shown in the graph are released from the ovaries.
Correct Answer:
Verified
Q83: Describe the role that sustentacular (Sertoli)cells play
Q84: Increased secretion of the hormone labeled _
Q85: Which of the following answer selections is
Q86: The structure labeled D in the diagram
Q87: Name and explain the functions of the
Q89: The graph shown below depicts the hormonal
Q90: All common forms of oral contraceptives contain
Q91: Briefly describe the events that comprise the
Q92: Which of the labeled structures in the
Q93: Describe the path that newly produced sperm
Unlock this Answer For Free Now!
View this answer and more for free by performing one of the following actions

Scan the QR code to install the App and get 2 free unlocks

Unlock quizzes for free by uploading documents