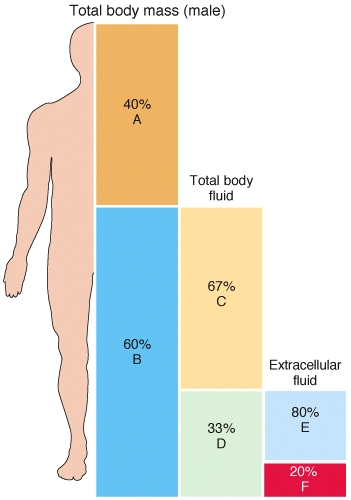
Which of the following sections of the bar graphs shown in the diagram would increase the most in an obese individual? 
A) A
B) B
C) C
D) D
E) E
Correct Answer:
Verified
Q64: Using the percentages and fractions given in
Q65: Which of the following answer selections best
Q66: Dehydration causes a loss of only interstitial
Q67: Which labeled section of the bar graphs
Q68: Explain water intoxication.
Q70: The thirst mechanism is an unreliable indicator
Q71: What type of receptors (labeled B in
Q72: Explain how dehydration is detected and how
Q73: Which of the following solutes would have
Q74: Name the major ions found in body
Unlock this Answer For Free Now!
View this answer and more for free by performing one of the following actions

Scan the QR code to install the App and get 2 free unlocks

Unlock quizzes for free by uploading documents