Data for calories and salt content (milligrams of sodium) in 17 brands of meat hot dogs are shown in the scatter diagram below.According to this diagram, it appears that hot dogs that are high in sodium are generally low in calories, and hot dogs with low sodium are generally high in calories. 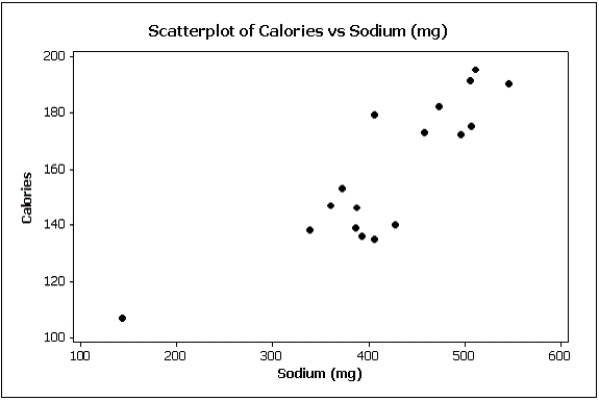
Correct Answer:
Verified
Q7: Correlation implies causation.
Q62: Briefly discuss the difference between cross-sectional data
Q63: Time series data are often graphically depicted
Q66: A line chart is created by plotting
Q68: Explain the difference between a histogram and
Q84: If two variables have a strong linear
Q88: The two most important characteristics revealed by
Q89: The graphical technique used to describe the
Q95: The relationship between two interval variables is
Q112: A professor examines the relationship between minutes
Unlock this Answer For Free Now!
View this answer and more for free by performing one of the following actions

Scan the QR code to install the App and get 2 free unlocks

Unlock quizzes for free by uploading documents