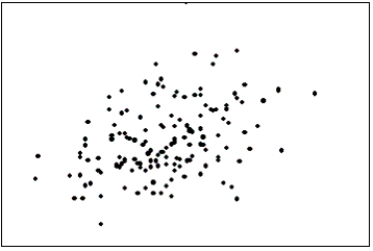
The first scatter diagram below shows a stronger linear relationship than the second scatter diagram.(Assume the scales on both scatter diagrams are the same.) 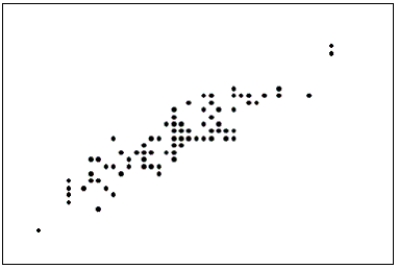
Correct Answer:
Verified
Q64: A(n)_ is created by plotting the value
Q74: Observations that are taken during successive points
Q87: In order to draw a scatter diagram,we
Q92: When two variables are linearly related,and tend
Q100: The two most important characteristics to examine
Q105: When one variable increases and the other
Q114: What are the two most important characteristics
Q117: Beef prices throughout the year (month 1
Q118: One of the variables used to help
Q119: The scatter diagram below depicts data with
Unlock this Answer For Free Now!
View this answer and more for free by performing one of the following actions

Scan the QR code to install the App and get 2 free unlocks

Unlock quizzes for free by uploading documents