The bar charts below summarize data collected on 100 adults regarding gender and pet ownership.Which of the following statements is (are) true based on this chart? 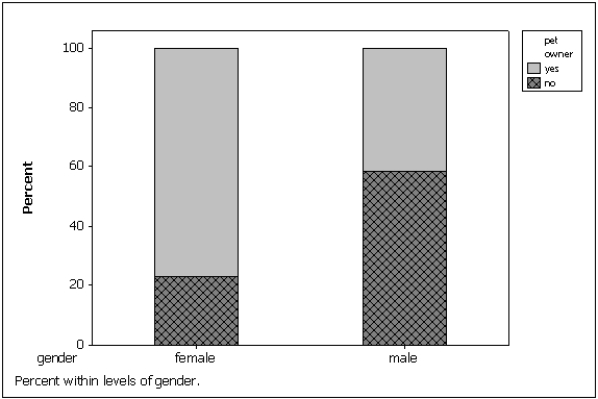
A) Gender and pet ownership are related; a higher percentage of males own pets than females.
B) Gender and pet ownership are related; a higher percentage of females own pets than males.
C) Gender and pet ownership are related; males and females own the same percentage of pets.
D) Gender and pet ownership are not related.
Correct Answer:
Verified
Q56: A pie chart is used to represent
Q59: Business School Graduates A sample of
Q61: Business School Graduates
A sample of business school
Q64: When studying the responses to two nominal
Q65: In the following cross-classification table, gender and
Q67: Two hundred males and two hundred females
Q69: Suppose you measure the number of minutes
Q72: If two nominal variables are unrelated,then the
Q77: A cross-classification table summarizes data from two
Q79: Business School Graduates A sample of
Unlock this Answer For Free Now!
View this answer and more for free by performing one of the following actions

Scan the QR code to install the App and get 2 free unlocks

Unlock quizzes for free by uploading documents