(Table: Hours Studied and Quiz Score) Use Table: Hours Studied and Quiz Score. The table shows data for students in an economics class. If we were to graph these data and draw a line through the points, we would choose _____ to be the independent variable; the vertical intercept of our line would be _____; and the slope of our line would be _____. 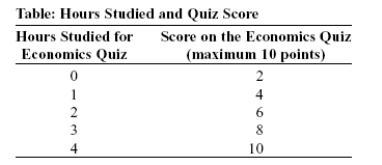
A) quiz score; y = 2; -2
B) quiz score; x = 0; -2
C) hours studied; y = 0; +2
D) hours studied; y = 2; +2
Correct Answer:
Verified
Q7: If two variables are negatively related,they will
Q8: On a two-dimensional graph representing two variables:
A)a
Q15: If two variables are positively related,on a
Q16: If two variables are positively related:
A)as one
Q19: If two variables are negatively related:
A)as one
Q264: Fertilizer,used to grow pumpkins,is a factor of
Q265: Labor and capital are the only two
Q266: Use the following to answer question:
Q267: If Jim buys a lunch at a
Q273: Absolute advantage is the basis for gains
Unlock this Answer For Free Now!
View this answer and more for free by performing one of the following actions

Scan the QR code to install the App and get 2 free unlocks

Unlock quizzes for free by uploading documents