Use the following to answer questions
This figure represents the distribution of the percent of state residents living in a metropolitan area for all 50 U.S.states and Washington D.C. 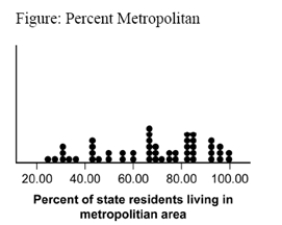
-(Figure: Percent Metropolitan) The plot in the figure is a:
A) histogram.
B) stem-and-leaf plot.
C) dot plot.
D) box plot.
Correct Answer:
Verified
Q53: The correct formula for the lower bound
Q54: Based on the statistical results provided, which
Q55: When performing a single-sample t test, an
Q56: A researcher conducts a single-sample t test
Q57: Which report of statistical results is in
Q59: A researcher collects 25 data points that
Q60: The correct formula for effect size
Q61: A sample of 20 with a standard
Q62: The standard deviation of the population is
Q63: The single-sample t test compares the mean
Unlock this Answer For Free Now!
View this answer and more for free by performing one of the following actions

Scan the QR code to install the App and get 2 free unlocks

Unlock quizzes for free by uploading documents