Use the following to answer questions
This figure represents the distribution of the percent of state residents living in a metropolitan area for all 50 U.S.states and Washington D.C. 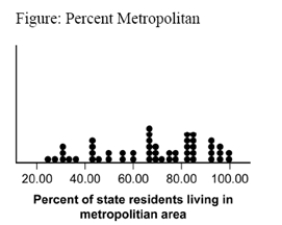
-(Figure: Percent Metropolitan) The figure indicates that:
A) most states have greater than 60 percent of their population living in metropolitan areas.
B) on average, 60 percent of all states' populations live in a metropolitan area.
C) the population of most states is concentrated in rural areas.
D) few states have larger urban centers.
Correct Answer:
Verified
Q39: H1: Q40: The second step in conducting the single-sample Q41: A team of researchers conducted a single-sample Q42: Imagine the average time to complete a Q43: Imagine the average time to complete a Q45: For the single-sample t test, the confidence Q46: When performing a single-sample t test, an Q47: The t test is a parametric statistical Q48: The final step in conducting the single-sample Q49: The correct formula for the upper bound
Unlock this Answer For Free Now!
View this answer and more for free by performing one of the following actions

Scan the QR code to install the App and get 2 free unlocks

Unlock quizzes for free by uploading documents