Use the following to answer questions
This histogram represents the distribution of the number of years of education completed by twins who attended the 16th Annual Twins Day Festival in Twinsburg, Ohio, in August of 1991.
Figure: Years of Education 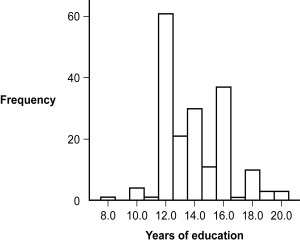
-(Figure: Years of Education) Based on the distribution, how many twins completed 13 years of education?
A) 11
B) 12
C) 20
D) 65
Correct Answer:
Verified
Q12: A _ is a data point that
Q13: Histograms are typically used to depict _,
Q14: Histograms typically provide frequencies for _ data.
A)
Q15: Raw data are observations or data points
Q16: If 2 out of 3 dentists recommend
Q18: When constructing a frequency table, the first
Q19: For which situation is a grouped frequency
Q20: A teacher calculated her students' test scores
Q21: _ distributions are those in which one
Q22: A normal distribution is also known as
Unlock this Answer For Free Now!
View this answer and more for free by performing one of the following actions

Scan the QR code to install the App and get 2 free unlocks

Unlock quizzes for free by uploading documents