Use the following to answer questions
This histogram represents the distribution of the number of years of education completed by twins who attended the 16th Annual Twins Day Festival in Twinsburg, Ohio, in August of 1991.
Figure: Years of Education 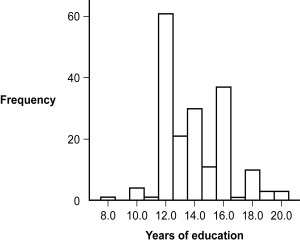
-(Figure: Years of Education) What seems to be the shape of this distribution?
A) negatively skewed
B) positively skewed
C) rectangle
D) symmetrical
Correct Answer:
Verified
Q5: Bar graphs typically provide scores for _
Q6: Use the following to answer questions
This
Q7: When constructing a frequency table, the final
Q8: Imagine that 180 people out of a
Q9: A _ is a visual depiction of
Q11: A _ visually depicts data based on
Q12: A _ is a data point that
Q13: Histograms are typically used to depict _,
Q14: Histograms typically provide frequencies for _ data.
A)
Q15: Raw data are observations or data points
Unlock this Answer For Free Now!
View this answer and more for free by performing one of the following actions

Scan the QR code to install the App and get 2 free unlocks

Unlock quizzes for free by uploading documents