Use the following to answer question
This histogram represents the frequency of graduation rates for all U.S.colleges (data collected by U.S.News & World Report, 1995) .
Figure: Graduation Rates 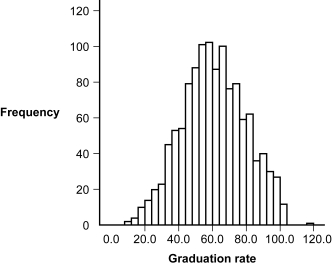
-(Figure: Graduation Rates) The shape of the distribution of graduation rates appears to be:
A) normal.
B) rectangular.
C) positively skewed.
D) negatively skewed.
Correct Answer:
Verified
Q34: A positive skew may have a tail
Q35: Use the following to answer questions
Q36: A frequency polygon is similar to a
Q37: A negative skew may have a tail
Q38: Professor Kellogg calculates the grades on the
Q40: Use the following to answer questions
This
Q41: The line drawn in a frequency polygon
Q42: Stem-and-leaf plots offer an advantage over histograms
Q43: A histogram is typically used to depict
Q44: It is advisable to use a grouped
Unlock this Answer For Free Now!
View this answer and more for free by performing one of the following actions

Scan the QR code to install the App and get 2 free unlocks

Unlock quizzes for free by uploading documents