Use the following to answer questions
The scatterplot and regression line on the left depict the relation between a state's expenditure per student and the average SAT scores for students in the state.The scatterplot and regression line on the right depict the relation between students' SAT Verbal and SAT Quantitative scores.
Figure: Standard Error Comparisons 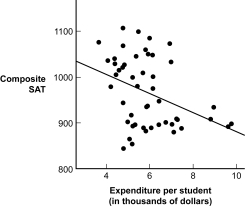
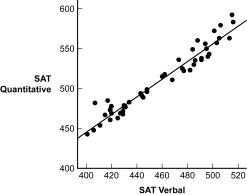
-(Figure: Standard Error Comparisons) Based on the scatterplots, for which prediction is the r2 greater?
A) state expenditure per student from composite SAT scores
B) composite SAT scores from the state's expenditure per student
C) SAT Quantitative scores from SAT Verbal scores
D) SAT Verbal scores from SAT Quantitative scores
Correct Answer:
Verified
Q30: The standardized regression coefficient expresses a predicted
Q31: For a simple linear regression, the standardized
Q32: Proportionate reduction in error can be symbolized
Q33: Which is the correct formula for
Q34: A man and woman who are both
Q36: As r2 increases, the standard error of
Q37: As the standard error of estimate becomes
Q38: The standard error of the estimate indicates:
A)
Q39: The regression line is the line that:
A)
Q40: Under what circumstance, unlikely as it might
Unlock this Answer For Free Now!
View this answer and more for free by performing one of the following actions

Scan the QR code to install the App and get 2 free unlocks

Unlock quizzes for free by uploading documents