Which of the following graphs illustrates the population growth curve starting with a single bacterium growing in a flask of ideal medium at optimum temperature over a two-hour period? Assume resources do not become limiting over this time frame.
A) 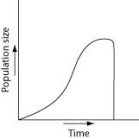
B) 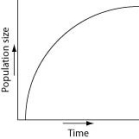
C) 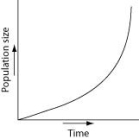
D) 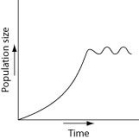
Correct Answer:
Verified
Q29: Which of the following causes populations to
Q30: According to the logistic growth equation,
Q31: Use the graph to answer the following
Q32: Use the graph to answer the following
Q33: During exponential growth, a population always _.
A)
Q35: Which of the following graphs best illustrates
Q36: As N approaches K for a certain
Q37: A population of ground squirrels has an
Q38: Use the graph to answer the following
Q39: Use the graph to answer the following
Unlock this Answer For Free Now!
View this answer and more for free by performing one of the following actions

Scan the QR code to install the App and get 2 free unlocks

Unlock quizzes for free by uploading documents