Use the following figure to answer the question.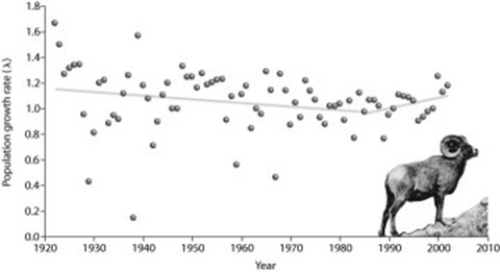
According to the figure, which two consecutive years had the largest change in the population growth rate?
A) 1967-1968
B) 1922-1923
C) 1938-1939
D) 1985-1986
Correct Answer:
Verified
Q30: Which of the following conditions is the
Q31: Managing southeastern forests specifically for the red-cockaded
Q31: Which one of the following is most
Q32: Which of the following strategies would most
Q32: If the sex ratio in a population
Q33: The main purpose of movement corridors is
Q35: Easter Island is an extremely isolated island
Q37: What strategy was used to rescue Illinois
Q38: Which of the following criteria have to
Q39: Use the following figure to answer the
Unlock this Answer For Free Now!
View this answer and more for free by performing one of the following actions

Scan the QR code to install the App and get 2 free unlocks

Unlock quizzes for free by uploading documents