Use the graphs to answer the question.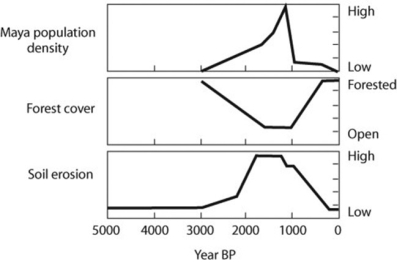
Archeological, fossil, and geological data provide information on the Mayan populations and their environment in Mexico, in the Caribbean state of Yucatán. The graphs depict population size, percentage of the land that was forested, and the amount of soil erosion. Based on the figure, what can you conclude about the history of land use in the southern Yucatán?
A) Massive soil erosion caused the Mayan population to crash.
B) Reduction in forest cover caused the Mayan population to crash.
C) As Mayan population increased, deforestation increased, probably leading to increased soil erosion.
D) This Mayan population practiced sustainable development.
Correct Answer:
Verified
Q26: Brown-headed cowbirds utilize fragmented forests effectively by
Q34: Which of the following nations has become
Q35: Movement corridors can be harmful to certain
Q43: Which of the following is a consequence
Q47: Which of the following outcomes is caused
Q49: Your friend is wary of environmentalists' claims
Q52: Use the following figure to answer the
Q53: What is the biggest problem with selecting
Q54: Why are changes in the global carbon
Q55: The main cause of the increase in
Unlock this Answer For Free Now!
View this answer and more for free by performing one of the following actions

Scan the QR code to install the App and get 2 free unlocks

Unlock quizzes for free by uploading documents