TABLE 2-15
The figure below is the ogive for the amount of fat (in grams) for a sample of 36 pizzas products where the upper boundaries of the intervals are: 5, 10, 15, 20, 25, and 30.
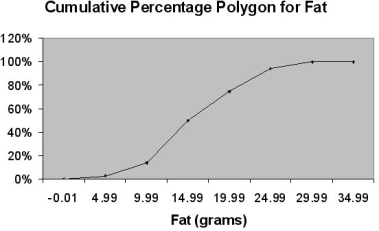
-Referring to Table 2-15, what percentage of pizza products contains at least 20 grams of fat?
A) 96%
B) 75%
C) 5%
D) 25%
Correct Answer:
Verified
Q43: Retailers are always interested in determining why
Q44: You have collected information on the market
Q45: In a contingency table, the number of
Q46: You have collected information on the consumption
Q47:
Q50:
Q51: TABLE 2-6
A sample of 200 students
Q52:
Q53: Data on the number of credit hours
Q164: TABLE 2-14
The table below contains the number
Unlock this Answer For Free Now!
View this answer and more for free by performing one of the following actions

Scan the QR code to install the App and get 2 free unlocks

Unlock quizzes for free by uploading documents