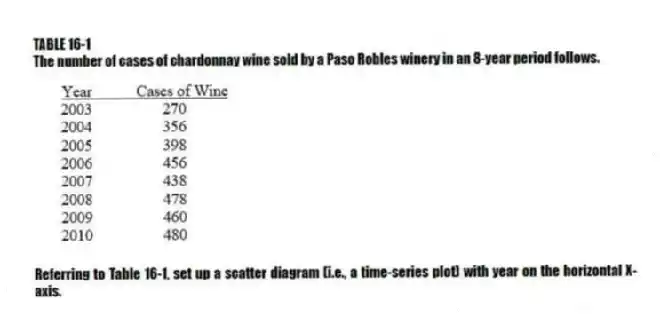
TABLE 16-1
The number of cases of chardonnay wine sold by a Paso Robles winery in an 8-year period follows. 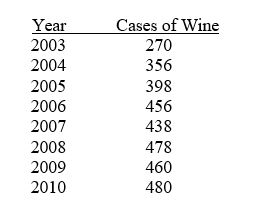
-Referring to Table 16-1, set up a scatter diagram (i.e., a time-series plot) with year on the horizontal X-axis.
Correct Answer:
Verified
Q23: The method of least squares may be
Q24: Each forecast using the method of exponential
Q27: To assess the adequacy of a forecasting
Q35: TABLE 16-1
The number of cases of chardonnay
Q39: The cyclical component of a time series
A)represents
Q40: The MAD is a measure of the
Q41: TABLE 16-3
The following table contains the number
Q42: TABLE 16-4
The number of cases of merlot
Q43: TABLE 16-3
The following table contains the number
Q44: TABLE 16-4
The number of cases of merlot
Unlock this Answer For Free Now!
View this answer and more for free by performing one of the following actions

Scan the QR code to install the App and get 2 free unlocks

Unlock quizzes for free by uploading documents