TABLE 13-12
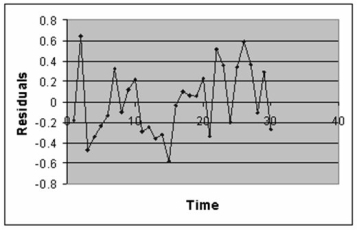
The manager of the purchasing department of a large banking organization would like to develop a model to predict the amount of time (measured in hours) it takes to process invoices. Data are collected from a sample of 30 days, and the number of invoices processed and completion time in hours is recorded. Below is the regression output:
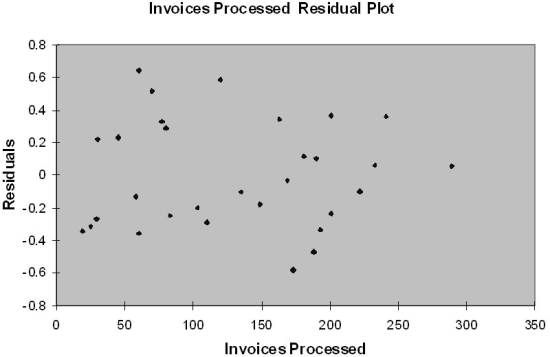
-Referring to Table 13-12, the degrees of freedom for the F test on whether the number of invoices processed affects the amount of time are
A) 1, 29.
B) 28, 1.
C) 29, 1.
D) 1, 28.
Correct Answer:
Verified
Q1: TABLE 13-10
The management of a chain
Q2: TABLE 13-7
An investment specialist claims that
Q3: TABLE 13-2
A candy bar manufacturer is
Q4: TABLE 13-2
A candy bar manufacturer is
Q6: TABLE 13-2
A candy bar manufacturer is
Q7: TABLE 13-9
It is believed that, the
Q8: Which of the following assumptions concerning the
Q9: TABLE 13-9
It is believed that, the
Q10: TABLE 13-2
A candy bar manufacturer is
Q11: TABLE 13-9
It is believed that, the
Unlock this Answer For Free Now!
View this answer and more for free by performing one of the following actions

Scan the QR code to install the App and get 2 free unlocks

Unlock quizzes for free by uploading documents