TABLE 13- 11
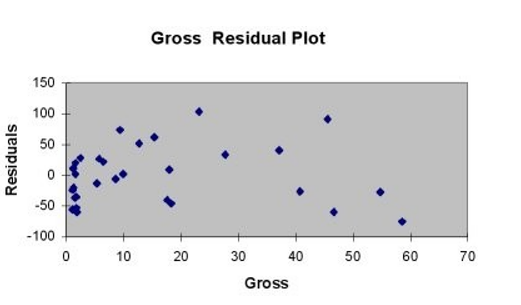
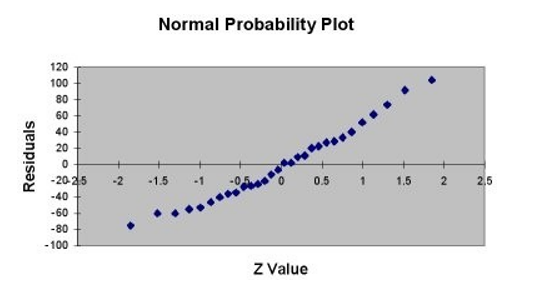
A company that has the distribution rights to home video sales of previously released movies would like to use the box office gross (in millions of dollars) to estimate the number of units (in thousands of units) that it can expect to sell. Following is the output from a simple linear regression along with the residual plot and normal probability plot obtained from a data set of 30 different movie titles:
ANOVA
-Referring to Table 13-11, which of the following is the correct alternative hypothesis for testing whether there is a linear relationship between box office gross and home video unit sales?
A)
B)
C)
D)
Correct Answer:
Verified
Q52: TABLE 13- 11
A company that has
Q53: TABLE 13-8
It is believed that GPA
Q54: TABLE 13-6
The following EXCEL tables are
Q55: TABLE 13-12
The manager of the purchasing
Q56: In performing a regression analysis involving two
Q58: If the Durbin-Watson statistic has a value
Q59: TABLE 13-2
A candy bar manufacturer is
Q60: TABLE 13-8
It is believed that GPA
Q61: TABLE 13-8
It is believed
Q62: TABLE 13-2
A candy bar
Unlock this Answer For Free Now!
View this answer and more for free by performing one of the following actions

Scan the QR code to install the App and get 2 free unlocks

Unlock quizzes for free by uploading documents