TABLE 13- 11
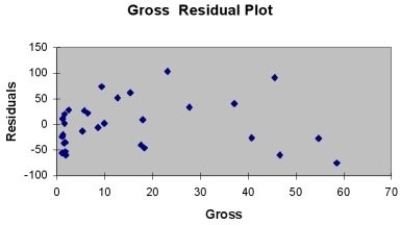
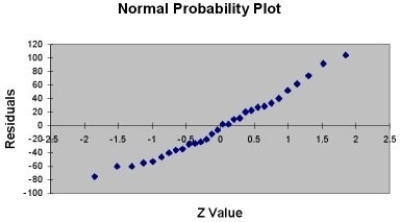
A company that has the distribution rights to home video sales of previously released movies would like to use the box office gross (in millions of dollars) to estimate the number of units (in thousands of units) that it can expect to sell. Following is the output from a simple linear regression along with the residual plot and normal probability plot obtained from a data set of 30 different movie titles:
ANOVA


-Referring to Table 13-11, what is the p-value for testing whether there is a linear relationship between box office gross and home video unit sales at a 5% level of significance?
Correct Answer:
Verified
View Answer
Unlock this answer now
Get Access to more Verified Answers free of charge
Q40: TABLE 13-3
The director of cooperative education at
Q46: TABLE 13-4
The managers of a brokerage firm
Q55: TABLE 13-4
The managers of a brokerage firm
Q66: TABLE 13-4
The managers of a brokerage firm
Q98: TABLE 13-4
The managers of a brokerage
Q99: TABLE 13-3
The director of cooperative education
Q103: TABLE 13-4
The managers of a brokerage
Q104: TABLE 13-3
The director of cooperative
Q107: TABLE 13-3
The director of cooperative
Q134: TABLE 13-10
The management of a chain electronic
Unlock this Answer For Free Now!
View this answer and more for free by performing one of the following actions

Scan the QR code to install the App and get 2 free unlocks

Unlock quizzes for free by uploading documents