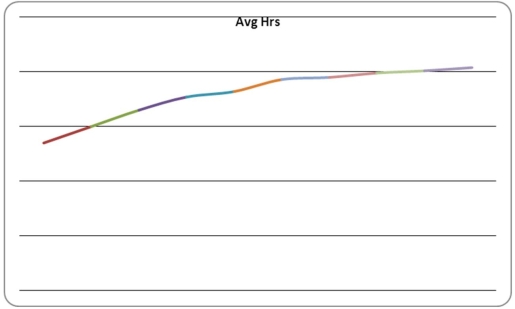
Using the following data table of the average hours per week spent on Internet activities by 15- to 18-year-olds for the years 1999-2008,construct the runs plot and interpret.
Correct Answer:
Verified
View Answer
Unlock this answer now
Get Access to more Verified Answers free of charge
Q45: Data collected for a particular study are
Q46: A(n)_ variable can have values that indicate
Q49: When the data being studied are gathered
Q51: If we collect data on the number
Q52: One method of determining whether a sample
Q54: Statistical _ refers to using a sample
Q55: A sequence of operations that takes inputs
Q85: _ refers to describing the important aspects
Q86: Looking at the runs plot of gasoline
Q95: A study is being conducted on the
Unlock this Answer For Free Now!
View this answer and more for free by performing one of the following actions

Scan the QR code to install the App and get 2 free unlocks

Unlock quizzes for free by uploading documents