An investor wants to compare the risks associated with two different stocks. One way to measure the risk of a given stock is to measure the variation in the stock's daily price changes. The investor obtains a random sample of 20 daily price changes for stock 1 and 20 daily price changes for stock 2. These data are shown in the table below. Show how this investor can compare the risks associated with the two stocks by testing the null hypothesis that the variances of the stocks are equal. Use  = 0.10 and interpret the results of the statistical test.
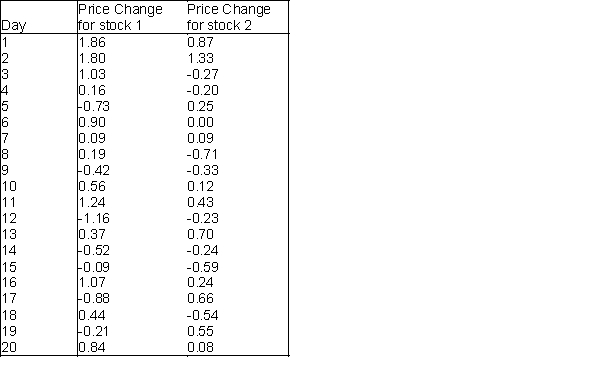
Correct Answer:
Verified
View Answer
Unlock this answer now
Get Access to more Verified Answers free of charge
Q21: A Q-Q plot can be used to
Q32: A chi-square goodness-of-fit test can be used
Q68: A real estate agency wants to compare
Q69: A statistics professor has just given a
Q71: What is the idea behind the chi-square
Q72: The manager of a consulting firm in
Q74: (A) Construct a 90% confidence interval for
Q75: The owner of a popular Internet-based auction
Q76: Which pair of tests is used to
Q78: Q-Mart is interested in comparing customers who
Unlock this Answer For Free Now!
View this answer and more for free by performing one of the following actions

Scan the QR code to install the App and get 2 free unlocks

Unlock quizzes for free by uploading documents