Suppose that the table shown below contains information technology (IT) investment as a percentage of total investment for eight countries during a recent decade. It also contains the average annual percentage change in employment during this decade. Explain how these data shed light on the question of whether IT investment creates or costs jobs. (Hint: Use the data to construct a scatterplot.) 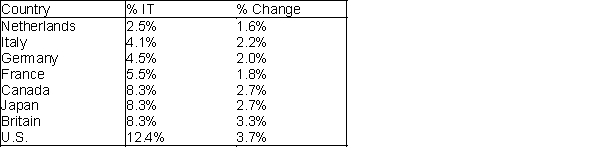
Correct Answer:
Verified
View Answer
Unlock this answer now
Get Access to more Verified Answers free of charge
Q19: If the coefficient of correlation r =
Q41: An economic development researcher wants to understand
Q42: What other data would you need to
Q43: An economic development researcher wants to understand
Q45: For which of the two variables, number
Q46: Which two variables have the strongest linear
Q47: Economists believe that historically, countries with more
Q48: What does a scatterplot illustrate?
A) whether there
Q49: Data has been collected on store size
Q50: It is possible that the data points
Unlock this Answer For Free Now!
View this answer and more for free by performing one of the following actions

Scan the QR code to install the App and get 2 free unlocks

Unlock quizzes for free by uploading documents