The following scatterplot compares the selling price and the appraised value. 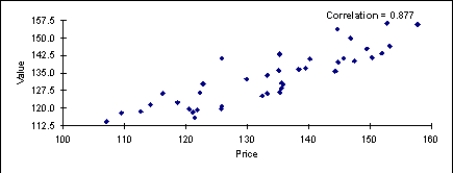 Is there a linear relationship between these two variables? If so, how would you characterize the relationship?
Correct Answer:
Verified
View Answer
Unlock this answer now
Get Access to more Verified Answers free of charge
Q15: If the standard deviation of X is
Q19: If the coefficient of correlation r =
Q48: What does a scatterplot illustrate?
A) whether there
Q49: Data has been collected on store size
Q50: It is possible that the data points
Q52: Do these data help to confirm or
Q54: There are two scatterplots shown below. The
Q56: Suppose that the percentage of a country's
Q57: How would you characterize the relationship between
Q58: The scatterplot is a graphical technique used
Unlock this Answer For Free Now!
View this answer and more for free by performing one of the following actions

Scan the QR code to install the App and get 2 free unlocks

Unlock quizzes for free by uploading documents