An operations management professor is interested in how her students performed on her midterm exam. The histogram shown below represents the distribution of exam scores (where the maximum score is 100) for 50 students. 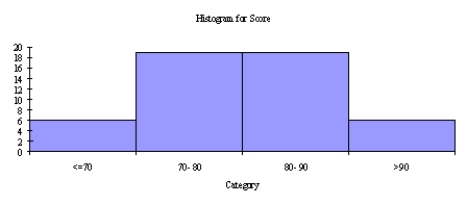 Based on this histogram, how would you characterize the students' performance on this exam?
Correct Answer:
Verified
View Answer
Unlock this answer now
Get Access to more Verified Answers free of charge
Q65: Are the empirical rules applicable in this
Q77: A sample of 8 observations with a
Q78: What can you say about the shape
Q80: In an effort to provide more consistent
Q81: The histogram below represents scores achieved by
Q83: A think tank of economists is interested
Q84: Half of the job applicants scored below
Q85: How many job applicants scored between 10
Q86: In a generic box plot, the vertical
Q87: Abby has been keeping track of what
Unlock this Answer For Free Now!
View this answer and more for free by performing one of the following actions

Scan the QR code to install the App and get 2 free unlocks

Unlock quizzes for free by uploading documents