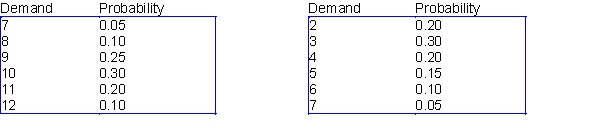
Oregon State University has reached the final four in the 2016 NCAA Women's Basketball Tournament, and as a result, a sweatshirt supplier in Corvallis is trying to decide how many sweatshirts to print for the upcoming championships. The final four teams (Oregon State, University of Washington, Syracuse, and University of Connecticut) have emerged from the quarterfinal round, and there is a week left until the semifinals, which are then followed in a couple of days by the finals. Each sweatshirt costs $12 to produce and sells for $24. However, in three weeks, any leftover sweatshirts will be put on sale for half price, $12. The supplier assumes that the demand (in thousands) for his sweatshirts during the next three weeks, when interest is at its highest, follows the probability distribution shown in the table below. The residual demand, after the sweatshirts have been put on sale, also has the probability distribution shown in the table below. The supplier realizes that every sweatshirt sold, even at the sale price, yields a profit. However, he also realizes that any sweatshirts produced but not sold must be thrown away, resulting in a $12 loss per sweatshirt.
Demand distribution at regular price Demand distribution at reduced price
-Use @RISK simulation add-in to analyze the sweatshirt sales. Do this for normal distributions, where we assume that the regular demand is normally distributed with mean 10,000 and standard deviation 1500, and that the demand at the reduced price is normally distributed with mean 5,000 and standard deviation 1500.
Correct Answer:
Verified
View Answer
Unlock this answer now
Get Access to more Verified Answers free of charge
Q26: It is usually not too difficult to
Q27: When we maximize or minimize the value
Q29: A correlation matrix must always have 1's
Q30: Data tables in spreadsheet simulations are useful
Q35: Analysts often plan a simulation so that
Q36: Different random numbers generated by the computer
Q43: Which of the following statements are true?
A)The
Q55: Many companies have used simulation to determine
Q65: Oregon State University has reached the final
Q67: Oregon State University has reached the final
Unlock this Answer For Free Now!
View this answer and more for free by performing one of the following actions

Scan the QR code to install the App and get 2 free unlocks

Unlock quizzes for free by uploading documents