The marketing manager of a large supermarket chain would like to determine the effect of shelf space (in feet) on the weekly sales of international food (in hundreds of dollars). A random sample of 12 equal-sized stores is selected, with the following results: 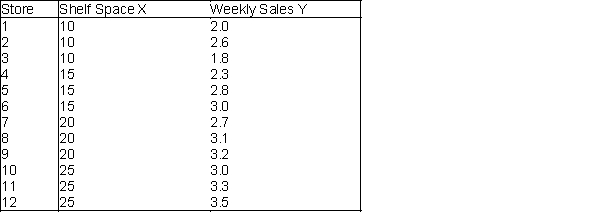
-(A) Draw a scatterplot,of the data and comment on the relationship between shelf space and weekly sales.
(B) Run a regression on this data set and report the results.
(C) What are the least squares regression coefficients of the Y-intercept (a) and slope (b)?
(D) Interpret the meaning of the slope
b.
(E) Predict the average weekly sales (in hundreds of dollars) of international food for stores with 13 feet of shelf space for international food.
(F) Why would it not be appropriate to predict the average weekly sales (in hundreds of dollars) of international food for stores with 35 feet of shelf space for international food?
(G) Identify the coefficient of determination,  , and interpret its meaning.
(H) Determine the standard error of the estimate. What does it represent?
(I) Draw a scatterplot of residuals versus fitted values. What does this graph indicate?
Correct Answer:
Verified
View Answer
Unlock this answer now
Get Access to more Verified Answers free of charge
Q82: An express delivery service company recently conducted
Q83: Adjustors working for a large insurance agency
Q84: The human resource manager at Gamma, Inc.
Q85: The station manager of a local television
Q86: La Cabaña, a popular motel chain in
Q87: The information below represents the relationship between
Q88: An automobile rental company wants to predict
Q90: A large auto dealership is interested in
Q91: A constant elasticity, or multiplicative, model the
Q92: A new online auction site specializes in
Unlock this Answer For Free Now!
View this answer and more for free by performing one of the following actions

Scan the QR code to install the App and get 2 free unlocks

Unlock quizzes for free by uploading documents