Actual sales of a company (in millions of dollars) for January through April are shown below. 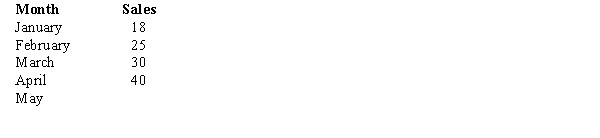
a.Use  = 0.3 to compute the exponential smoothing values for sales. Compute MSE and forecast sales for May. Show all of your computations from February through May.
b.Use  = 0.1 to compute the exponential smoothing values for sales. Compute MSE and forecast sales for May. Show all of your computations from February through May.
c.Based on MSE, which  provides a better forecast? Explain why?
Correct Answer:
Verified
View Answer
Unlock this answer now
Get Access to more Verified Answers free of charge
Q47: The sales records of a major auto
Q48: The following information has been collected on
Q49: What is the forecast for July based
Q50: The following time series shows the
Q51: The following data show the quarterly sales
Q53: Actual sales for January through April are
Q54: The sales volumes of CMM, Inc., a
Q55: The quarterly sales of a company (in
Q56: John has collected the following information on
Q57: Demand for a product and the forecasting
Unlock this Answer For Free Now!
View this answer and more for free by performing one of the following actions

Scan the QR code to install the App and get 2 free unlocks

Unlock quizzes for free by uploading documents