Exhibit 15-5
Below you are given a partial Minitab output based on a sample of 25 observations. 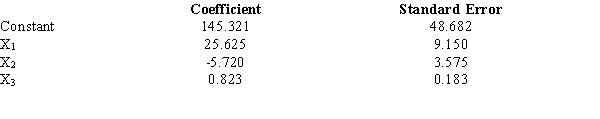
-Refer to Exhibit 15-5. The t value obtained from the table to test an individual parameter at the 5% level is
A) 2.06
B) 2.069
C) 2.074
D) 2.080
Correct Answer:
Verified
Q69: Exhibit 15-6
Below you are given a
Q70: Exhibit 15-6
Below you are given a partial
Q71: Exhibit 15-8
The following estimated regression model was
Q72: Exhibit 15-7
A regression model involving 4 independent
Q73: Exhibit 15-7
A regression model involving 4 independent
Q75: Exhibit 15-6
Below you are given a partial
Q76: Exhibit 15-8
The following estimated regression model was
Q77: Exhibit 15-6
Below you are given a partial
Q78: Exhibit 15-8
The following estimated regression model was
Q79: Exhibit 15-5
Below you are given a
Unlock this Answer For Free Now!
View this answer and more for free by performing one of the following actions

Scan the QR code to install the App and get 2 free unlocks

Unlock quizzes for free by uploading documents