The following data represent a company's yearly sales volume and its advertising expenditure over a period of 8 years. 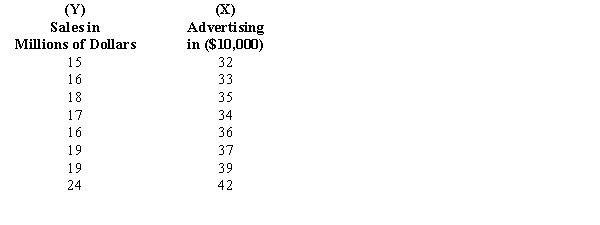
a. Develop a scatter diagram of sales versus advertising and explain what it shows regarding the relationship between sales and advertising.
b. Use the method of least squares to compute an estimated regression line between sales and advertising.
c. If the company's advertising expenditure is $400,000, what are the predicted sales? Give the answer in dollars.
d. What does the slope of the estimated regression line indicate?
e. Compute the coefficient of determination and fully interpret its meaning.
f. Use the F test to determine whether or not the regression model is significant at = 0.05.
Correct Answer:
Verified
View Answer
Unlock this answer now
Get Access to more Verified Answers free of charge
Q125: Given below are four observations collected
Q126: An automobile dealer wants to see if
Q127: Shown below is a portion of
Q128: Below you are given a partial
Q129: Below you are given information on
Q131: Below you are given a partial
Q132: Shown below is a portion of
Q133: The owner of a bakery wants to
Q134: Given below are seven observations collected
Q135: Jason believes that the sales of coffee
Unlock this Answer For Free Now!
View this answer and more for free by performing one of the following actions

Scan the QR code to install the App and get 2 free unlocks

Unlock quizzes for free by uploading documents