Exhibit 12-5
The table below gives beverage preferences for random samples of teens and adults. 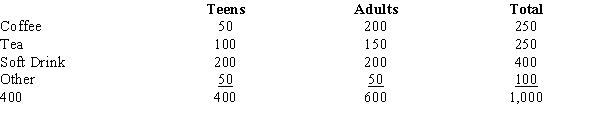 We are asked to test for independence between age (i.e., adult and teen) and drink preferences.
-Refer to Exhibit 12-5. The expected number of adults who prefer coffee is
A) 0.25
B) 0.33
C) 150
D) 200
Correct Answer:
Verified
Q30: Exhibit 12-4
In the past, 35% of the
Q31: Exhibit 12-3
In order to determine whether or
Q32: Exhibit 12-6
The owner of a car wash
Q33: Exhibit 12-3
In order to determine whether or
Q34: Exhibit 12-2
Last school year, the student body
Q36: Exhibit 12-5
The table below gives beverage preferences
Q37: Exhibit 12-2
Last school year, the student body
Q38: Exhibit 12-4
In the past, 35% of the
Q39: Exhibit 12-4
In the past, 35% of the
Q40: Exhibit 12-5
The table below gives beverage preferences
Unlock this Answer For Free Now!
View this answer and more for free by performing one of the following actions

Scan the QR code to install the App and get 2 free unlocks

Unlock quizzes for free by uploading documents