The following frequency distribution shows the ACT scores of a sample of students: 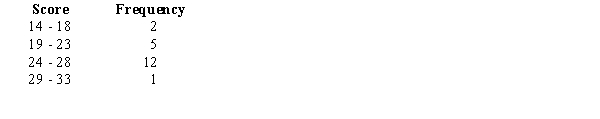 For the above data, compute the following.
a.The mean
b.The standard deviation
Correct Answer:
Verified
Q109: Exhibit 3-6
The closing stock price of MNM
Q110: In 2008, the average age of students
Q111: Exhibit 3-6
The closing stock price of MNM
Q112: A private research organization studying families in
Q113: Exhibit 3-6
The closing stock price of MNM
Q115: Exhibit 3-3
A researcher has collected the following
Q116: Exhibit 3-5
You are given the following frequency
Q117: Exhibit 3-6
The closing stock price of MNM
Q118: Exhibit 3-4
The following is the frequency distribution
Q119: Exhibit 3-6
The closing stock price of MNM
Unlock this Answer For Free Now!
View this answer and more for free by performing one of the following actions

Scan the QR code to install the App and get 2 free unlocks

Unlock quizzes for free by uploading documents