The following image is a 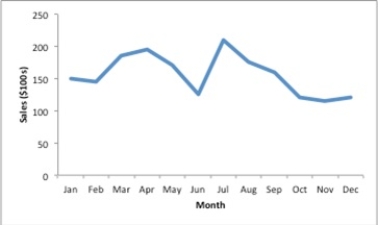
A) sparkline.
B) trendline.
C) gridline.
D) line chart.
Correct Answer:
Verified
Q6: In order to visualize three variables in
Q7: Bar charts use
A)horizontal bars to display the
Q8: A _ is a line that provides
Q9: The software package most commonly used for
Q10: In many cases, white space in a
Q12: Data-ink is the ink used in a
Q13: _ are visual methods of displaying data.
A)Tables
B)Charts
C)PivotTables
D)Crosstabs
Q14: Which one of the following statements is
Q15: Deleting the grid lines in a table
Q16: A _ is a graphical presentation of
Unlock this Answer For Free Now!
View this answer and more for free by performing one of the following actions

Scan the QR code to install the App and get 2 free unlocks

Unlock quizzes for free by uploading documents