This Excel bar chart displays the demographics of a Business Analysis class. Approximately how many students are in the class? 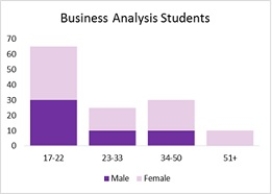
A) 175
B) 150
C) 105
D) 130
Correct Answer:
Verified
Q26: A disadvantage of stacked-column charts and stacked-bar
Q27: To generate a scatter chart matrix, we
Q28: To avoid problems in interpreting the differences
Q29: To summarize and analyze data with both
Q30: A PivotChart, in few instances, is the
Q32: An effective display of trend and magnitude
Q33: A _ is useful for visualizing hierarchical
Q34: _ merges maps and statistics to present
Q35: Consider the clustered bar chart of the
Q36: A _ is used for examining data
Unlock this Answer For Free Now!
View this answer and more for free by performing one of the following actions

Scan the QR code to install the App and get 2 free unlocks

Unlock quizzes for free by uploading documents