The scatter chart below displays the residuals versus the dependent variable, x. Which of the following conclusions can be drawn based upon this scatter chart? 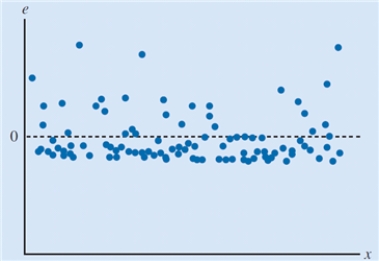
A) The residuals have a constant variance.
B) The model captures the relationship between the variables accurately.
C) The model underpredicts the value of the dependent variable for intermediate values of the independent variable.
D) The residual distribution is not normally distributed.
Correct Answer:
Verified
Q24: The degree of correlation among independent variables
Q25: A variable used to model the effect
Q26: A normally distributed error term with a
Q27: Which of the following regression models is
Q28: The process of making estimates and drawing
Q30: The scatter chart below displays the residuals
Q31: _ is used to test the hypothesis
Q32: The coefficient of determination
A)takes values between -1
Q33: The scatter chart below displays the residuals
Q34: The process of making a conjecture about
Unlock this Answer For Free Now!
View this answer and more for free by performing one of the following actions

Scan the QR code to install the App and get 2 free unlocks

Unlock quizzes for free by uploading documents