A time series plot of a period of time (quarterly) versus quarterly sales (in $1,000s) is shown below. Which of the following data patterns best describes the scenario shown? 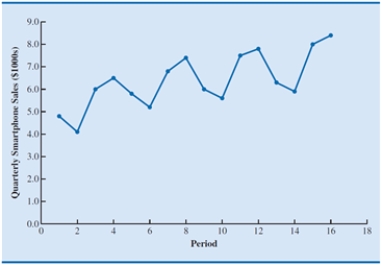
A) Linear trend and cyclical pattern
B) Linear trend and horizontal pattern
C) Seasonal and cyclical patterns
D) Seasonal pattern and linear trend
Correct Answer:
Verified
Q11: If a time series plot exhibits a
Q12: The mean absolute error, mean squared error,
Q13: Which of the following states the objective
Q14: Which of the following is not present
Q15: A time series that shows a recurring
Q17: A set of observations on a variable
Q18: Which of the following is not true
Q19: Forecast error
A)takes a positive value when the
Q20: If the forecasted value of the time
Q21: For causal modeling, _ are used to
Unlock this Answer For Free Now!
View this answer and more for free by performing one of the following actions

Scan the QR code to install the App and get 2 free unlocks

Unlock quizzes for free by uploading documents