Using the graph below, the feasible region for the function represented in the graph is 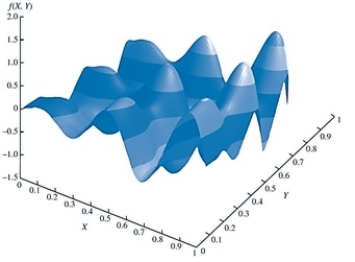
A) -1 £ X £ 1, -1 £ Y £ 1.
B) -1.5 £ X £ 1, 0 £ Y £ 8.
C) -1.5 £ X £ 2.0, -1.5 £ Y £ 2.0.
D) 0 £ X �£ 1, 0 £ Y £ 1.
Correct Answer:
Verified
Q19: A _ is the shadow price of
Q20: In reviewing the image below, which of
Q21: In the Bass forecasting model, the _
Q22: In reviewing the image below, what is
Q23: The measure of risk most often associated
Q25: The _ option in Excel Solver is
Q26: Using the graph below, which of the
Q27: Which of the following conclusions can be
Q28: A(n) _ is a set of points
Q29: In the Bass forecasting model, the _
Unlock this Answer For Free Now!
View this answer and more for free by performing one of the following actions

Scan the QR code to install the App and get 2 free unlocks

Unlock quizzes for free by uploading documents