NARRBEGIN: Home Care
Home Care
Data are collected on the number of house calls (x) made in a given week by each of 60 nurses in a certain hospital. The same data set is displayed in each of the three histograms below. 

 NARREND
-The scatter diagram below depicts data with a negative linear relationship. 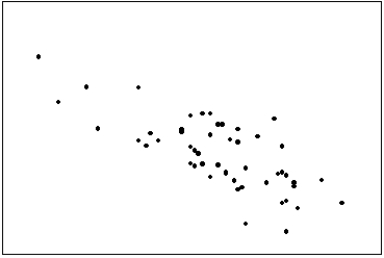
Correct Answer:
Verified
Q7: Correlation implies causation.
Q22: NARRBEGIN: Home Care
Home Care
Data are collected on
Q24: NARRBEGIN: Home Care
Home Care
Data are collected
Q55: A line chart is created by plotting
Q84: If two variables have a strong linear
Q88: The two most important characteristics revealed by
Q94: In applications involving two variables,X and Y,where
Q97: Which of the following describes a positive
Q113: It is speculated that the number of
Q119: A(n)_ is a graphical display consisting of
Unlock this Answer For Free Now!
View this answer and more for free by performing one of the following actions

Scan the QR code to install the App and get 2 free unlocks

Unlock quizzes for free by uploading documents