NARRBEGIN: Home Care
Home Care
Data are collected on the number of house calls (x) made in a given week by each of 60 nurses in a certain hospital. The same data set is displayed in each of the three histograms below. 

 NARREND
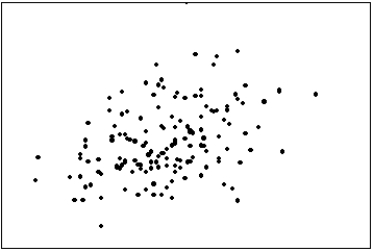
-The first scatter diagram below shows a stronger linear relationship than the second scatter diagram. (Assume the scales on both scatter diagrams are the same.) 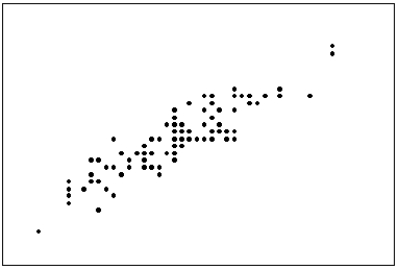
Correct Answer:
Verified
Q7: Correlation implies causation.
Q81: How do you determine whether two interval
Q84: If two variables have a strong linear
Q85: When two variables tend to move in
Q88: The two most important characteristics revealed by
Q89: The graphical technique used to describe the
Q94: In applications involving two variables,X and Y,where
Q95: The relationship between two interval variables is
Q97: Which of the following describes a positive
Q100: The two most important characteristics to examine
Unlock this Answer For Free Now!
View this answer and more for free by performing one of the following actions

Scan the QR code to install the App and get 2 free unlocks

Unlock quizzes for free by uploading documents