Solved

NARRBEGIN: Home Care
Home Care
Data Are Collected on the Number

Question 34

Essay

NARRBEGIN: Home Care
Home Care
Data are collected on the number of house calls (x) made in a given week by each of 60 nurses in a certain hospital. The same data set is displayed in each of the three histograms below.  NARRBEGIN: Home Care Home Care Data are collected on the number of house calls (x) made in a given week by each of 60 nurses in a certain hospital. The same data set is displayed in each of the three histograms below.       NARREND -An economics professor wants to study the relationship between income and education. A sample of 10 individuals is selected at random, and their income (in thousands of dollars) and education (in years) are shown below:   \begin{array}{|l|llllllllll|} \hline \text { Education } & 12 & 14 & 10 & 11 & 13 & 8 & 10 & 15 & 13 & 12 \\ \hline \text { Income } & 25 & 31 & 20 & 24 & 28 & 15 & 21 & 35 & 29 & 27\\\hline \end{array}   a.Draw a scatter diagram for these data with the income on the vertical axis. b.Describe the relationship between income and education.  NARRBEGIN: Home Care Home Care Data are collected on the number of house calls (x) made in a given week by each of 60 nurses in a certain hospital. The same data set is displayed in each of the three histograms below.       NARREND -An economics professor wants to study the relationship between income and education. A sample of 10 individuals is selected at random, and their income (in thousands of dollars) and education (in years) are shown below:   \begin{array}{|l|llllllllll|} \hline \text { Education } & 12 & 14 & 10 & 11 & 13 & 8 & 10 & 15 & 13 & 12 \\ \hline \text { Income } & 25 & 31 & 20 & 24 & 28 & 15 & 21 & 35 & 29 & 27\\\hline \end{array}   a.Draw a scatter diagram for these data with the income on the vertical axis. b.Describe the relationship between income and education.  NARRBEGIN: Home Care Home Care Data are collected on the number of house calls (x) made in a given week by each of 60 nurses in a certain hospital. The same data set is displayed in each of the three histograms below.       NARREND -An economics professor wants to study the relationship between income and education. A sample of 10 individuals is selected at random, and their income (in thousands of dollars) and education (in years) are shown below:   \begin{array}{|l|llllllllll|} \hline \text { Education } & 12 & 14 & 10 & 11 & 13 & 8 & 10 & 15 & 13 & 12 \\ \hline \text { Income } & 25 & 31 & 20 & 24 & 28 & 15 & 21 & 35 & 29 & 27\\\hline \end{array}   a.Draw a scatter diagram for these data with the income on the vertical axis. b.Describe the relationship between income and education. NARREND
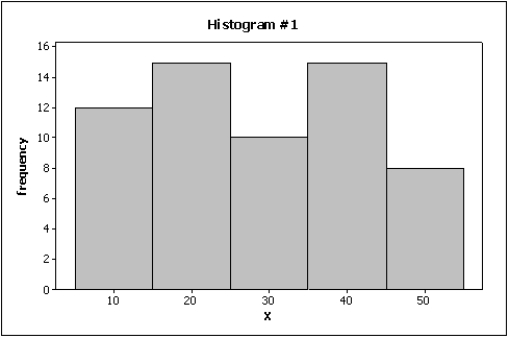
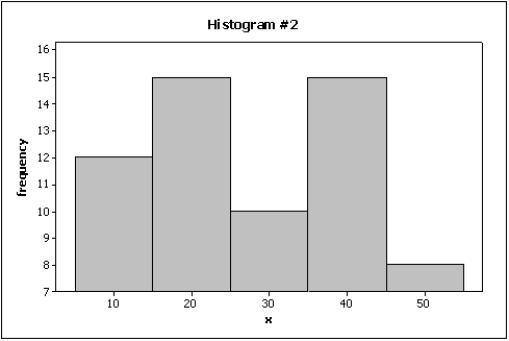
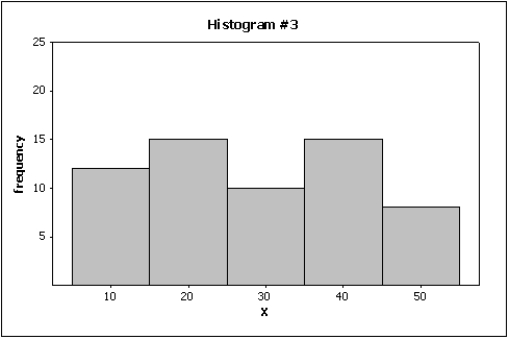
-An economics professor wants to study the relationship between income and education. A sample of 10 individuals is selected at random, and their income (in thousands of dollars) and education (in years) are shown below:
 Education 1214101113810151312 Income 25312024281521352927\begin{array}{|l|llllllllll|}\hline \text { Education } & 12 & 14 & 10 & 11 & 13 & 8 & 10 & 15 & 13 & 12 \\\hline \text { Income } & 25 & 31 & 20 & 24 & 28 & 15 & 21 & 35 & 29 & 27\\\hline\end{array}
a.Draw a scatter diagram for these data with the income on the vertical axis.
b.Describe the relationship between income and education.

Correct Answer:

verifed

Verified

a.b.There is a very strong pos...

View Answer

Unlock this answer now
Get Access to more Verified Answers free of charge

Related Questions

Unlock this Answer For Free Now!

View this answer and more for free by performing one of the following actions

qr-code

Scan the QR code to install the App and get 2 free unlocks

upload documents

Unlock quizzes for free by uploading documents