NARRBEGIN: Home Care
Home Care
Data are collected on the number of house calls (x) made in a given week by each of 60 nurses in a certain hospital. The same data set is displayed in each of the three histograms below. 

 NARREND
-The graph below represents a line graph. 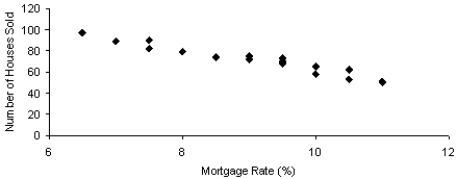
Correct Answer:
Verified
Q7: Time series data are often graphically depicted
Q11: The intervals (classes)in a histogram do not
Q61: Observations that are measured at the same
Q63: Time series data are often graphically depicted
Q75: Observations that are measured at the same
Q80: Which of the following represents time-series data?
A)The
Q103: The two most important characteristics to look
Q105: When one variable increases and the other
Q115: Can a scatter diagram be used to
Q117: Briefly explain the difference between correlation and
Unlock this Answer For Free Now!
View this answer and more for free by performing one of the following actions

Scan the QR code to install the App and get 2 free unlocks

Unlock quizzes for free by uploading documents