NARRBEGIN: Home Care
Home Care
Data are collected on the number of house calls (x) made in a given week by each of 60 nurses in a certain hospital. The same data set is displayed in each of the three histograms below. 

 NARREND
-The line chart below shows tomato prices each month from January (month 1) to December last year ($ per pound). By looking at this chart you can see the lowest tomato prices occurred in July. 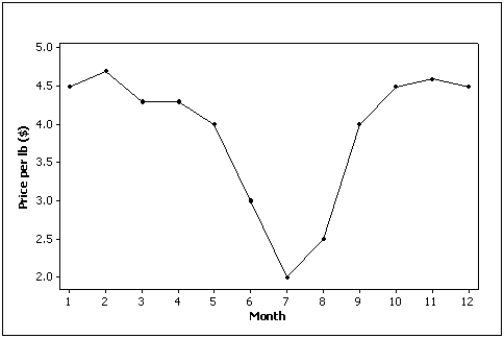
Correct Answer:
Verified
Q24: NARRBEGIN: Home Care
Home Care
Data are collected
Q29: NARRBEGIN: Home Care
Home Care
Data are collected
Q55: A line chart is created by plotting
Q60: A line chart that is flat shows
Q101: An individual's income depends somewhat on their
Q108: If when one variable increases the other
Q110: In applications involving two variables,X and Y,where
Q114: What are the two most important characteristics
Q118: One of the variables used to help
Q119: A(n)_ is a graphical display consisting of
Unlock this Answer For Free Now!
View this answer and more for free by performing one of the following actions

Scan the QR code to install the App and get 2 free unlocks

Unlock quizzes for free by uploading documents