NARRBEGIN: Home Care
Home Care
Data are collected on the number of house calls (x) made in a given week by each of 60 nurses in a certain hospital. The same data set is displayed in each of the three histograms below. 

 NARREND
-Which of the following statements describe(s) the line chart below? 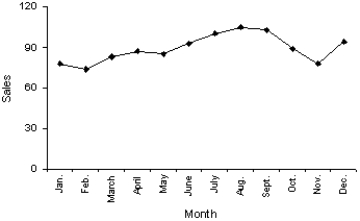
A) November experienced the lowest sales throughout the year.
B) August experienced the highest sales throughout the year.
C) Sales did not fluctuate more than 30 units on either side of 90.
D) All of these choices are true.
Correct Answer:
Verified
Q6: A histogram is said to be symmetric
Q7: The number of observations within each class
Q9: A stem-and-leaf display represents nominal data.
Q10: In a histogram,each observation is assigned to
Q54: NARRBEGIN: Home Care
Home Care
Data are collected on
Q57: NARRBEGIN: Home Care
Home Care
Data are collected on
Q58: NARRBEGIN: Home Care
Home Care
Data are collected on
Q62: NARRBEGIN: Home Care
Home Care
Data are collected
Q64: A(n)_ is created by plotting the value
Q77: Time-series data are often graphically depicted how?
A)Bar
Unlock this Answer For Free Now!
View this answer and more for free by performing one of the following actions

Scan the QR code to install the App and get 2 free unlocks

Unlock quizzes for free by uploading documents