The following tables give the death rates, per 100,000 population, by age for selected years for males and females. If matrix M gives the male data and matrix F gives the female data, find matrix M - F and describe what it means.
Males 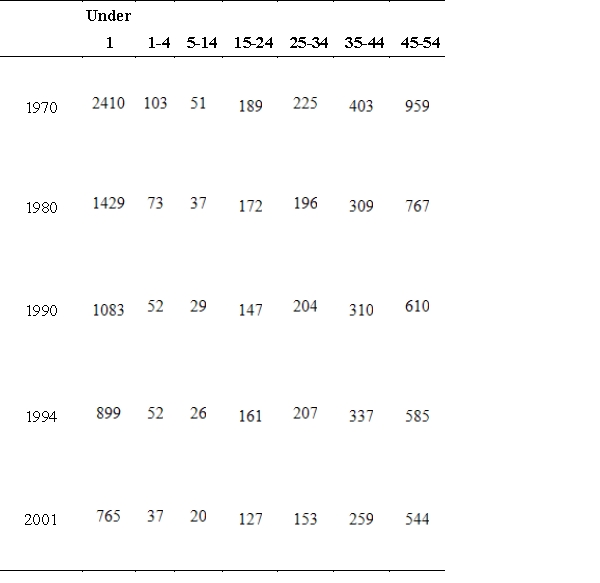 Females
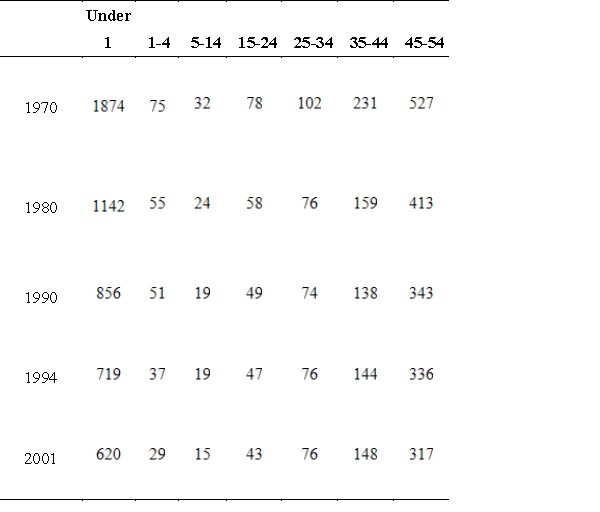
A) 
M - F represents how much greater the numbers are for males in each category per year.
B) 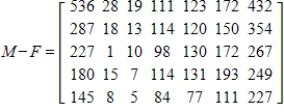
M - F represents how much greater the numbers are for males in each category per year.
C) 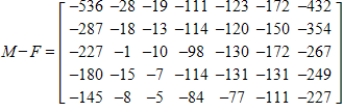
M - F represents how much greater the numbers are for females in each category per year.
D) 
M - F represents how much greater the numbers are for females in each category per year.
E) 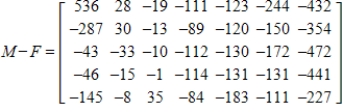
M - F represents only the male death rates, per 100,000 population by age.
Correct Answer:
Verified
Q33: The following tables give the rank and
Q34: The following tables give the rank and
Q35: The following tables give the capital expenditures
Q36: The following tables give the death rates,
Q37: Find x, y, z, and w .
Q39: Find x, y, z and w.
Q40: Let matrix A represent the sales (in
Q41: In order to rank the five members
Q42: Use matrix A to find A2, if
Q43: In order to rank the five members
Unlock this Answer For Free Now!
View this answer and more for free by performing one of the following actions

Scan the QR code to install the App and get 2 free unlocks

Unlock quizzes for free by uploading documents