The following figure shows a graph that compares the present values of two ordinary annuities of $800 quarterly as functions of the number of quarters. One annuity is at an annual rate of 6% compounded quarterly, and the other is at 9% compounded quarterly. What present value is required to purchase an annuity of $800 a quarter for 25 years with an interest rate of 9% compounded quarterly? Check your answer against the graph. Round your answer to the nearest cent. 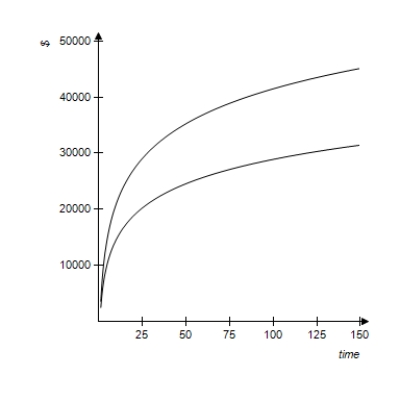
A) $31,713.39
B) $40,440.73
C) $27,577.08
D) $39,107.20
E) $52,000.00
Correct Answer:
Verified
Q93: Decide whether the problem relates to an
Q94: Suppose that Ian Greitzer deposits his $13,000
Q95: If $67,000 is invested in an annuity
Q96: Recent sales of some real estate and
Q97: Suppose that Tom Martin deposits his $11,500
Q99: A year-end bonus of $15,000 will generate
Q100: Suppose that Scott Andrews deposits his $10,500
Q101: Given 5 and 30 year loans with
Q102: A woman buys an apartment house for
Q103: Find the present value of an annuity
Unlock this Answer For Free Now!
View this answer and more for free by performing one of the following actions

Scan the QR code to install the App and get 2 free unlocks

Unlock quizzes for free by uploading documents