Suppose the figure shows the total cost graph for a company. Arrange the average rates of change of total cost from A to B, B to C, and A to C from smallest to greatest. 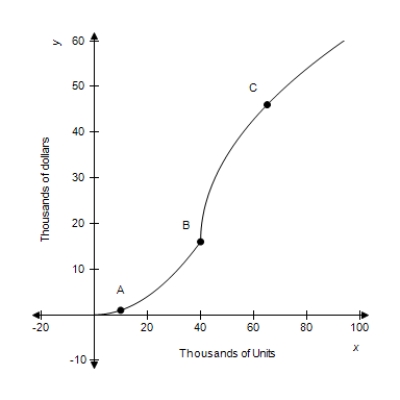
A) A to B then A to C then B to C
B) B to C then A to C then A to B
C) A to C then A to B then B to C
D) A to C then B to C then A to B
E) B to C then A to B then A to C
Correct Answer:
Verified
Q84: If the total revenue function for a
Q85: Because the derivative of a function represents
Q86: Because the derivative of a function represents
Q87: Find Q88: Write the equation of the line tangent Q90: Suppose the total revenue function for a Q91: Given the graph of Q92: Find the derivative of the function. Q93: Suppose the graph shows a manufacturer's total Q94: Given the graph of Unlock this Answer For Free Now! View this answer and more for free by performing one of the following actions Scan the QR code to install the App and get 2 free unlocks Unlock quizzes for free by uploading documents![]()
![]()
![]()

