The graph of a company's total cost function is shown. Does this total cost function represent a manufacturing process that is getting more efficient or less efficient as the production level increases? 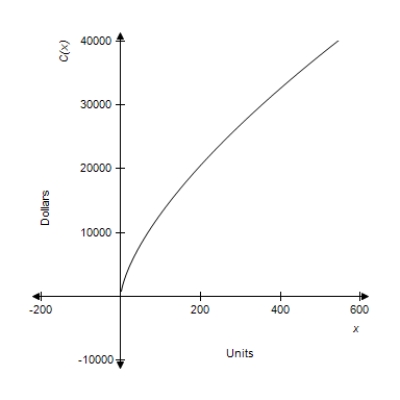
A) less efficient
B) more efficient
Correct Answer:
Verified
Q231: The following table shows the numbers of
Q232: If the cost function for a commodity
Q233: Total revenue is in dollars and x
Q234: Total revenue is in dollars and x
Q235: In this problem, cost, revenue, and profit
Q237: The graph of a company's total cost
Q238: Suppose that the cost function for a
Q239: In this problem, cost, revenue, and profit
Q240: Suppose that the cost function for a
Q241: The graphs of a company's total revenue
Unlock this Answer For Free Now!
View this answer and more for free by performing one of the following actions

Scan the QR code to install the App and get 2 free unlocks

Unlock quizzes for free by uploading documents