The following figure shows the graph of revenue function  and cost function
  . At which of the four
  -values shown is the profit largest?
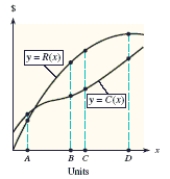
A) B
B) C
C) D
D) A
E) Profit is largest at more than one x-value.
Correct Answer:
Verified
Q98: If the total cost function for a
Q99: For the revenue function given by
Q100: Find the x-value at which the absolute
Q101: The monthly demand function for x units
Q102: A time study showed that, on average,
Q104: A ball thrown into the air from
Q105: The profit from a grove of orange
Q106: Suppose that the monthly cost in dollars
Q107: A firm can produce 100 units per
Q108: A product can be produced at a
Unlock this Answer For Free Now!
View this answer and more for free by performing one of the following actions

Scan the QR code to install the App and get 2 free unlocks

Unlock quizzes for free by uploading documents