Use the figure for the question(s) below.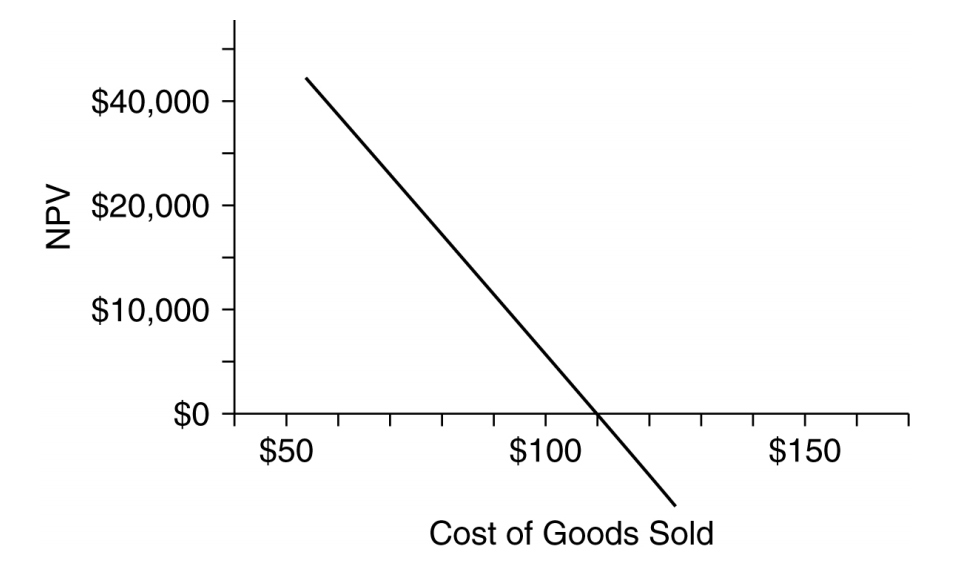
-The graph above shows the break-even analysis for the cost of making a certain good. Based on this chart, which of the following is true?
A) The net present value (NPV) of the project increases with increased cost of goods sold.
B) The net present value (NPV) of the project will be positive if the cost of good sold is greater than $110.
C) If the good costs $110 to make, the net present value (NPV) of the project will be zero.
D) The project should not be undertaken if the predicted cost of goods sold is less than $110.
Correct Answer:
Verified
Q12: Capital budgeting decisions use the Net Present
Q18: What is the correct tax rate that
Q33: To evaluate a capital budgeting decision, it
Q35: The cash flow effect from a change
Q60: Cameron Industries is purchasing a new chemical
Q65: Firms should use the most accelerated depreciation
Q73: What is 'break-even analysis'?
Q84: What are sunk costs?
Q107: Why does the option to abandon a
Q111: A real option is the obligation to
Unlock this Answer For Free Now!
View this answer and more for free by performing one of the following actions

Scan the QR code to install the App and get 2 free unlocks

Unlock quizzes for free by uploading documents