Solved

Carnivores a Random Sample of Some of the Heaviest Carnivores =668+485 =-668+485

Question 15

Essay

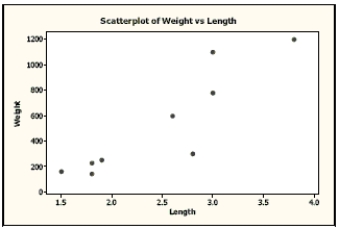
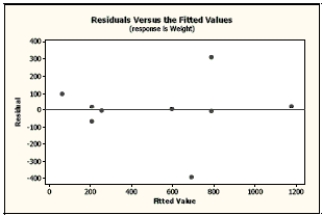
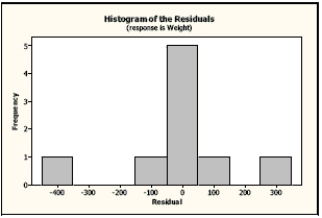
Carnivores A random sample of some of the heaviest carnivores on Earth was reviewed to determine if there is an association between the length (in meters) and weight (in kilograms) of these carnivores. Here are the scatterplot, the residuals plot, a histogram of the residuals, and the regression analysis of the data. Use this information to analyze the association between the length and weight of these carnivores.

The regression equation is
Weight =668+485 =-668+485 Length
 Predictor  Coef  SE Coef  T  P  Constant 668.3232.82.870.024 Length 485.2190.635.350.001\begin{array}{lrrrr}\text { Predictor } & \text { Coef } & \text { SE Coef } & \text { T } & \text { P } \\\text { Constant } & -668.3 & 232.8 & -2.87 & 0.024 \\\text { Length } & 485.21 & 90.63 & 5.35 & 0.001\end{array}
S=194.794RSq=80.48RSq(adj)=77.68S=194.794 \quad R-S q=80.48 \quad R-S q(a d j)=77.68

 Carnivores A random sample of some of the heaviest carnivores on Earth was reviewed to determine if there is an association between the length (in meters) and weight (in kilograms) of these carnivores. Here are the scatterplot, the residuals plot, a histogram of the residuals, and the regression analysis of the data. Use this information to analyze the association between the length and weight of these carnivores.   The regression equation is  Weight   =-668+485   Length  \begin{array}{lrrrr} \text { Predictor } & \text { Coef } & \text { SE Coef } & \text { T } & \text { P } \\ \text { Constant } & -668.3 & 232.8 & -2.87 & 0.024 \\ \text { Length } & 485.21 & 90.63 & 5.35 & 0.001 \end{array}   S=194.794 \quad R-S q=80.48 \quad R-S q(a d j)=77.68                a. Is there an association? Write appropriate hypotheses.  b. Are the assumptions for regression satisfied? Explain.  c. What do you conclude? d. Create a 98% confidence interval for the true slope.  e. Explain in context what your interval means.
 Carnivores A random sample of some of the heaviest carnivores on Earth was reviewed to determine if there is an association between the length (in meters) and weight (in kilograms) of these carnivores. Here are the scatterplot, the residuals plot, a histogram of the residuals, and the regression analysis of the data. Use this information to analyze the association between the length and weight of these carnivores.   The regression equation is  Weight   =-668+485   Length  \begin{array}{lrrrr} \text { Predictor } & \text { Coef } & \text { SE Coef } & \text { T } & \text { P } \\ \text { Constant } & -668.3 & 232.8 & -2.87 & 0.024 \\ \text { Length } & 485.21 & 90.63 & 5.35 & 0.001 \end{array}   S=194.794 \quad R-S q=80.48 \quad R-S q(a d j)=77.68                a. Is there an association? Write appropriate hypotheses.  b. Are the assumptions for regression satisfied? Explain.  c. What do you conclude? d. Create a 98% confidence interval for the true slope.  e. Explain in context what your interval means.
 Carnivores A random sample of some of the heaviest carnivores on Earth was reviewed to determine if there is an association between the length (in meters) and weight (in kilograms) of these carnivores. Here are the scatterplot, the residuals plot, a histogram of the residuals, and the regression analysis of the data. Use this information to analyze the association between the length and weight of these carnivores.   The regression equation is  Weight   =-668+485   Length  \begin{array}{lrrrr} \text { Predictor } & \text { Coef } & \text { SE Coef } & \text { T } & \text { P } \\ \text { Constant } & -668.3 & 232.8 & -2.87 & 0.024 \\ \text { Length } & 485.21 & 90.63 & 5.35 & 0.001 \end{array}   S=194.794 \quad R-S q=80.48 \quad R-S q(a d j)=77.68                a. Is there an association? Write appropriate hypotheses.  b. Are the assumptions for regression satisfied? Explain.  c. What do you conclude? d. Create a 98% confidence interval for the true slope.  e. Explain in context what your interval means.
a. Is there an association? Write appropriate hypotheses.
b. Are the assumptions for regression satisfied? Explain.
c. What do you conclude?
d. Create a 98% confidence interval for the true slope.
e. Explain in context what your interval means.

Correct Answer:

verifed

Verified

a. H0: There is no association between t...

View Answer

Unlock this answer now
Get Access to more Verified Answers free of charge

Related Questions

Unlock this Answer For Free Now!

View this answer and more for free by performing one of the following actions

qr-code

Scan the QR code to install the App and get 2 free unlocks

upload documents

Unlock quizzes for free by uploading documents